Campaign:
Little World of Data
Client:
Aviva Investors
Overview
Each year Aviva Investors produces an extremely successful piece of content called ‘The Little Black Book of Data’. In 2021, Aviva wanted to take a new approach on how they engage their partners, investors and staff and share these insights.
Jellyfish Agency approached HF to create a Virtual Reality experience for Aviva transforming their Little Book of Data into an engaging 360VR experience – bringing their data to life in new and interesting ways.
Approach
HF collaborated with JellyFish on the creative concept, script writing, creative direction, and storyboard development, to deliver a full 360 storyboard and a CGI previs which we used to gain client buy-in for the full production of the linear 360VR experience.
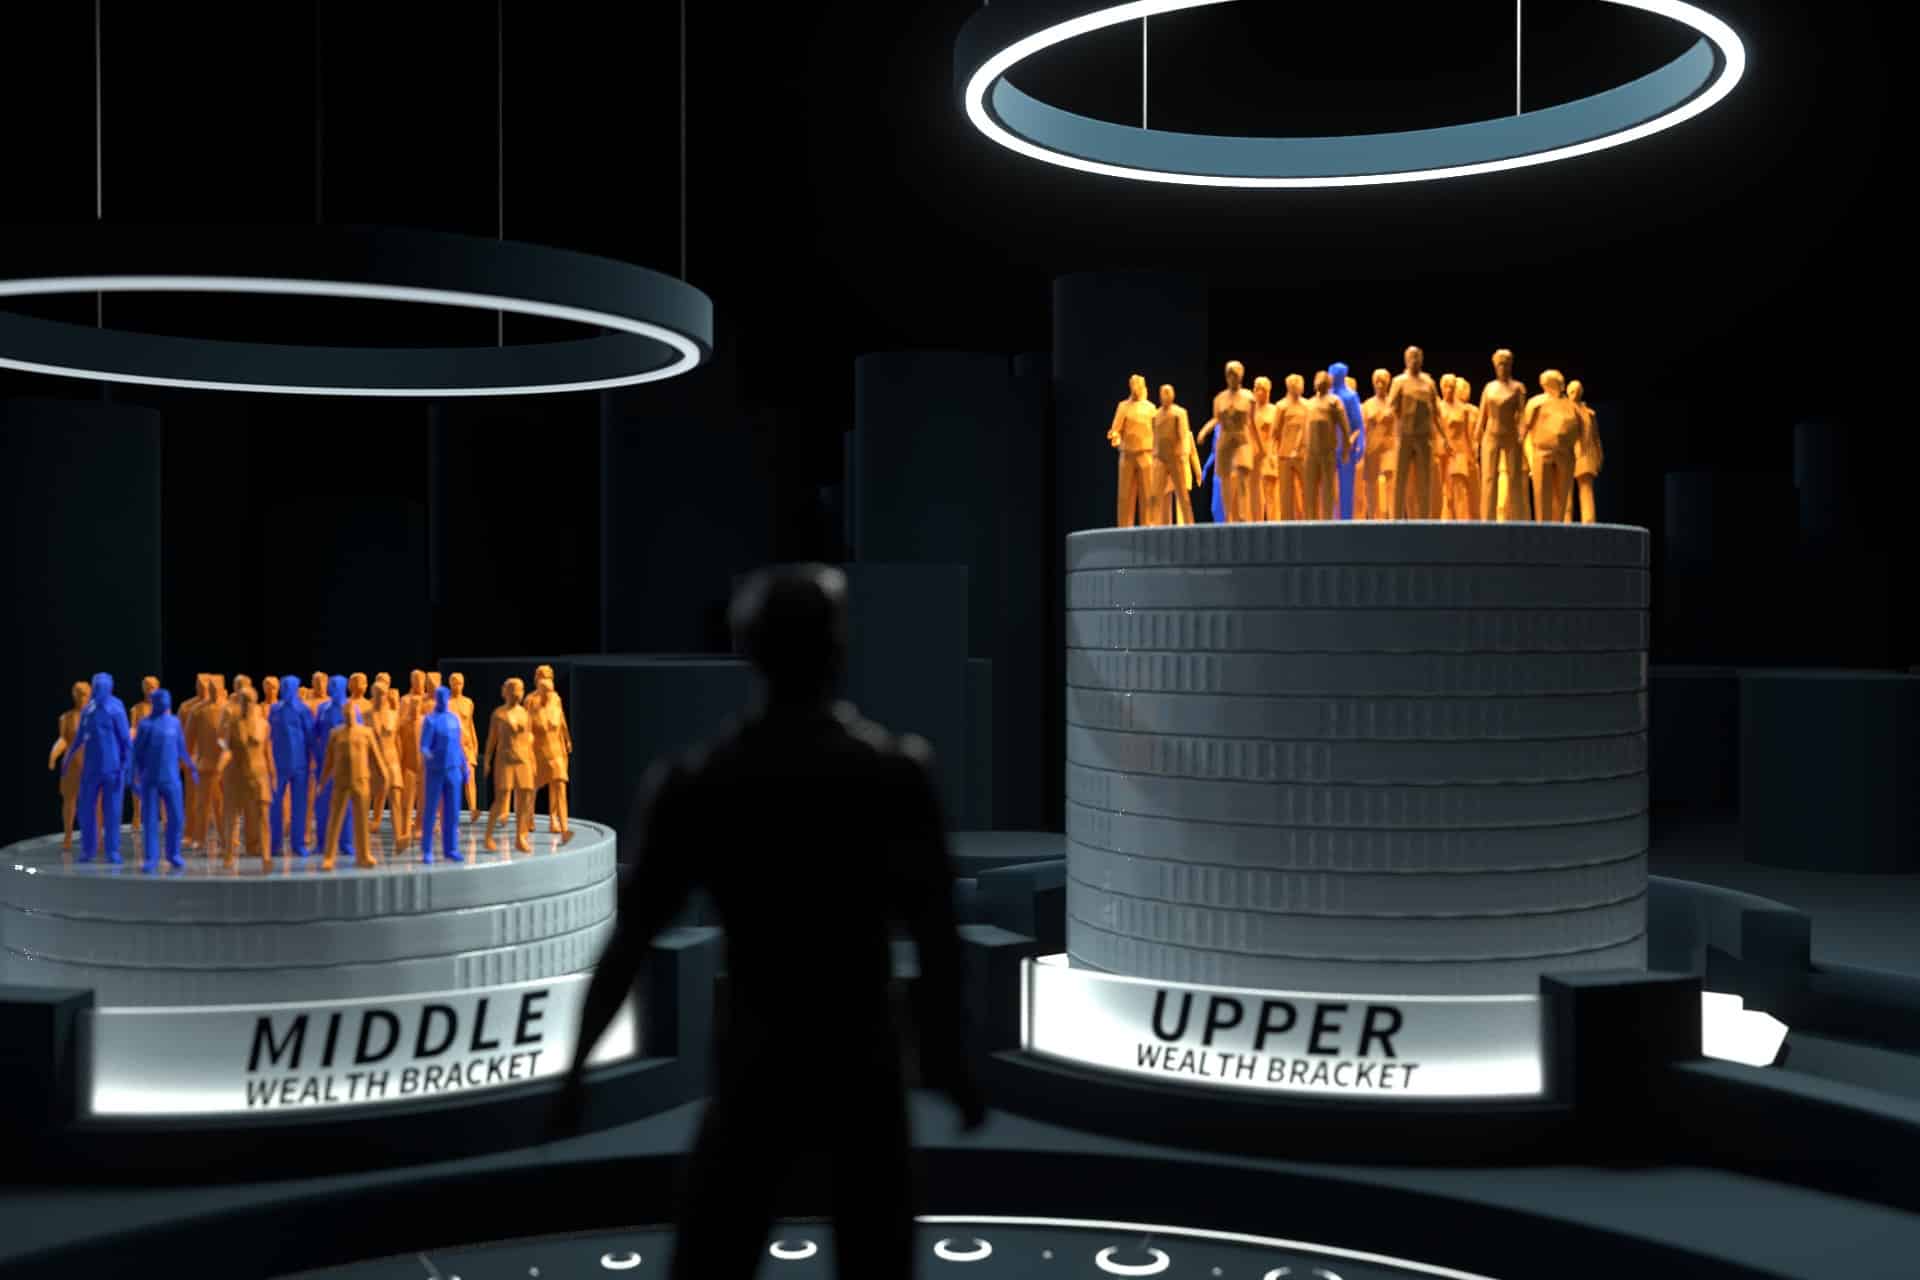
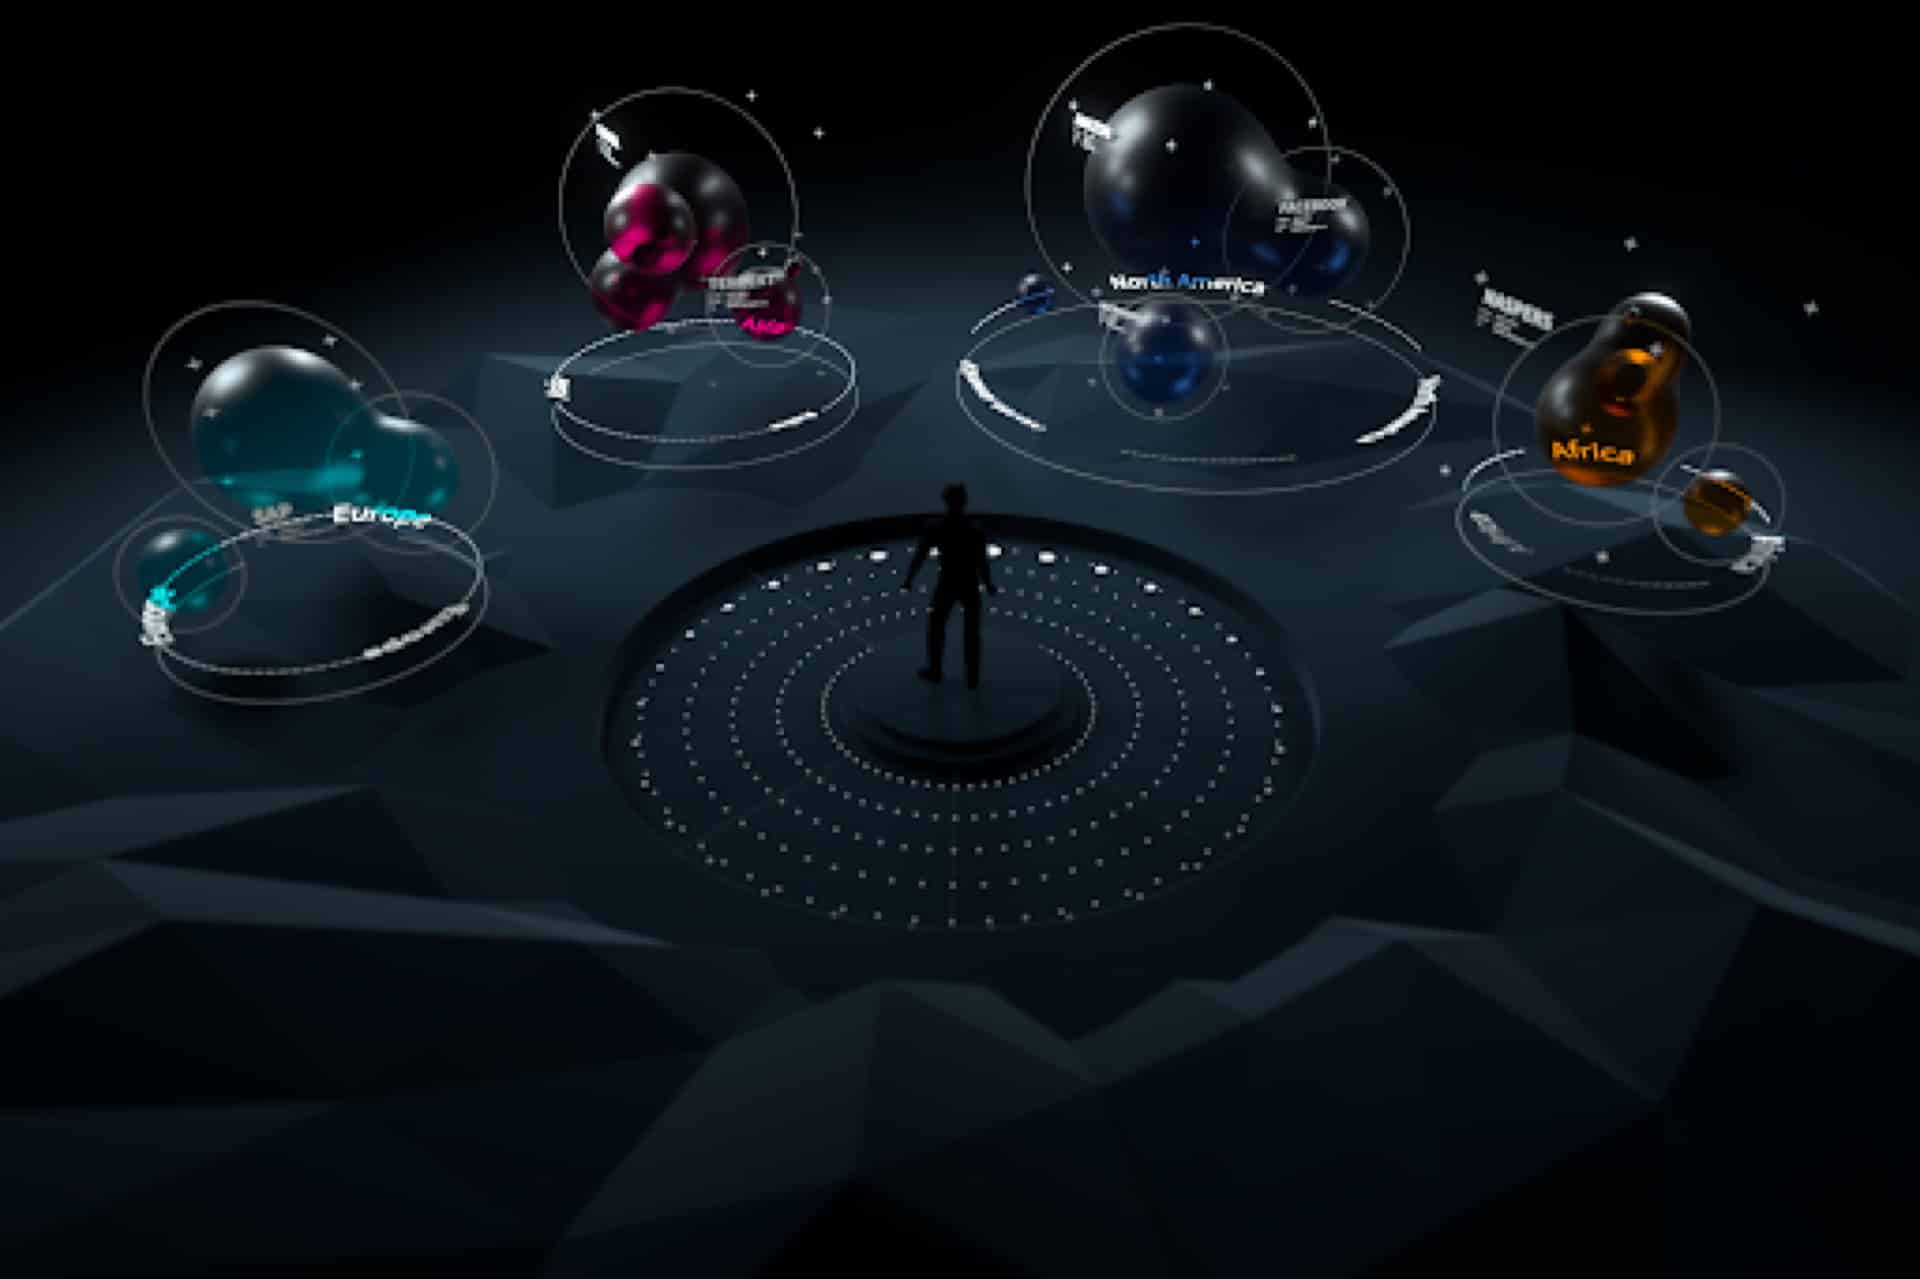
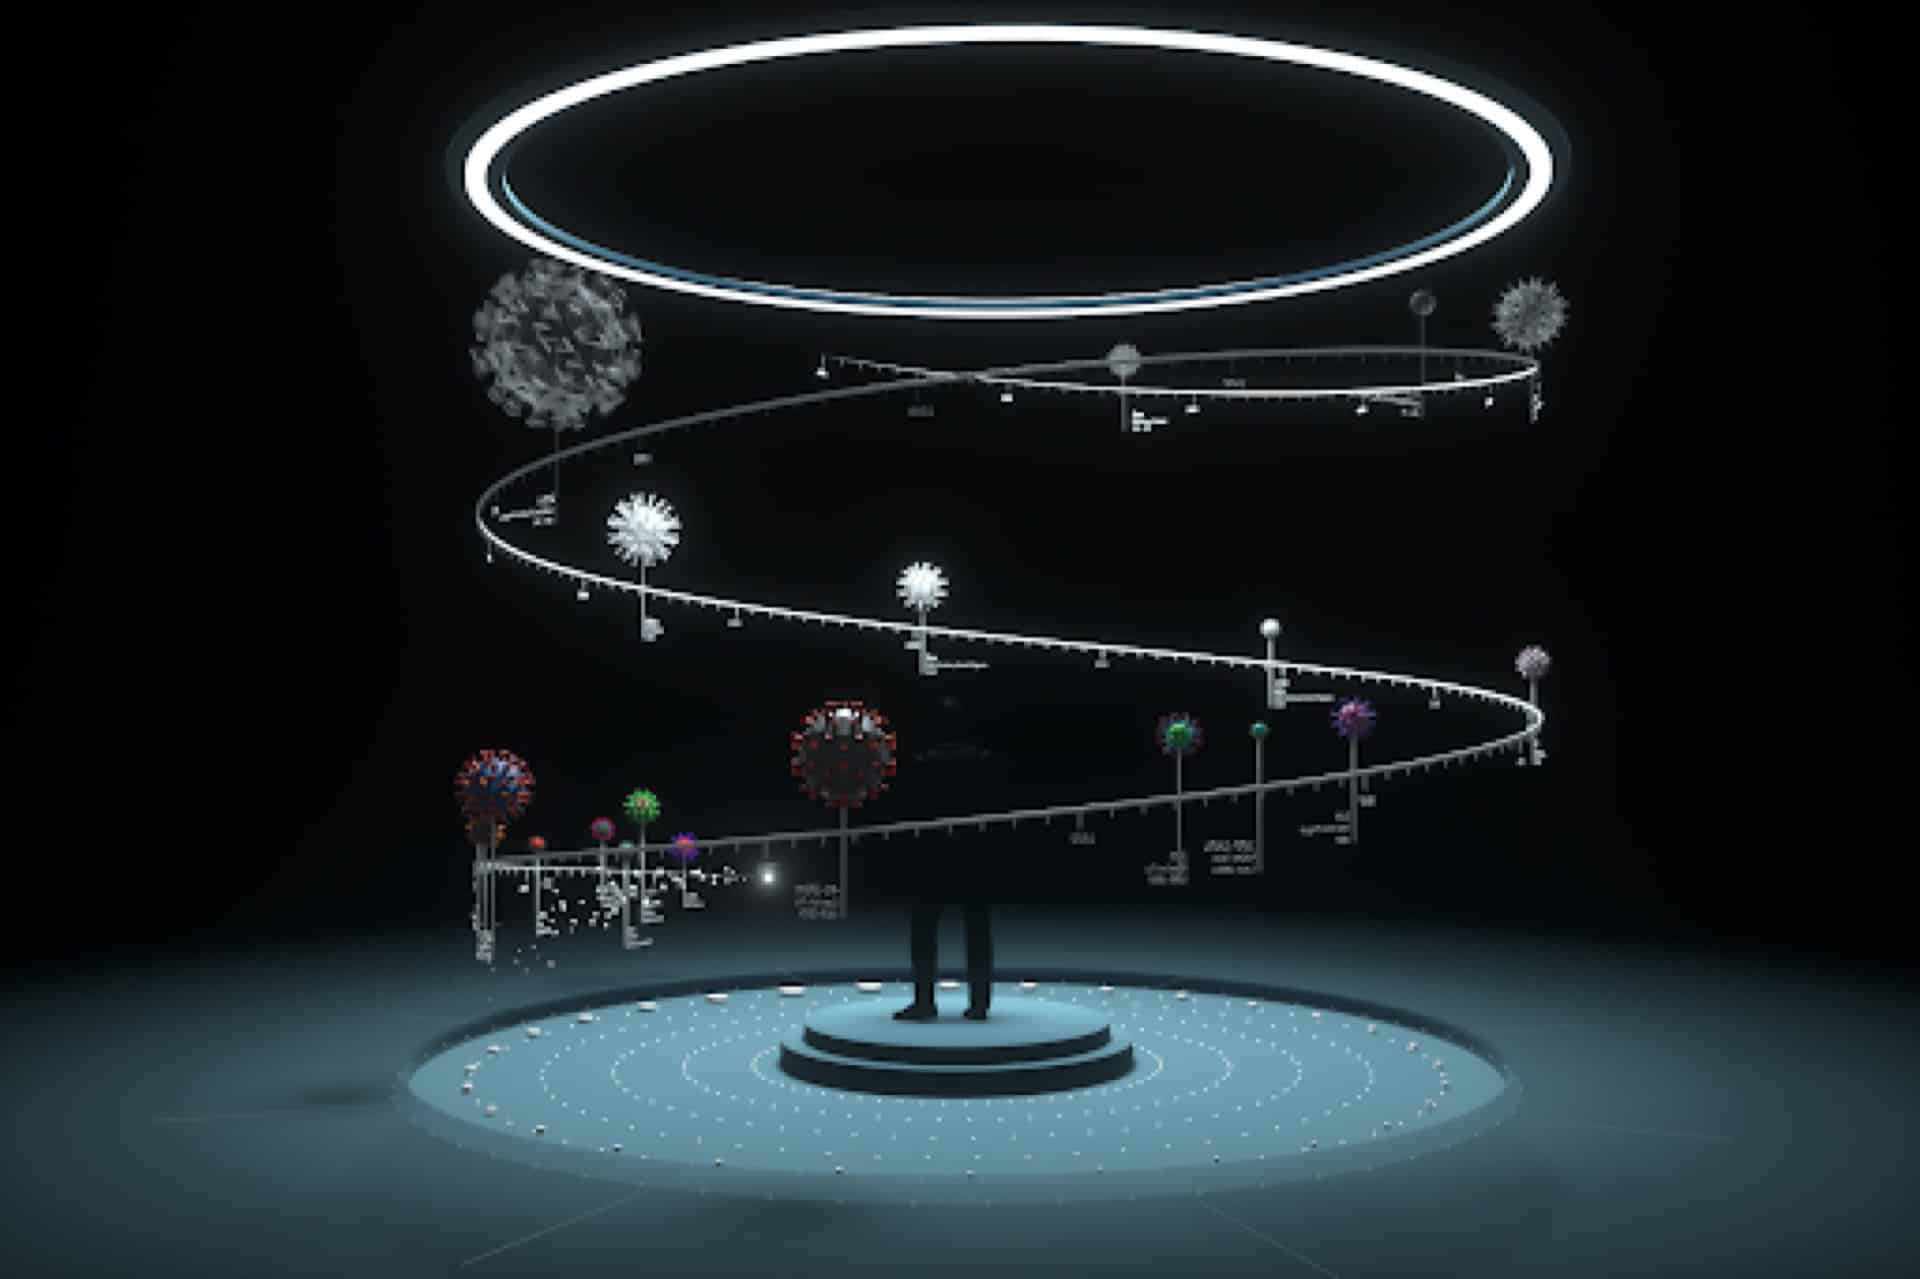
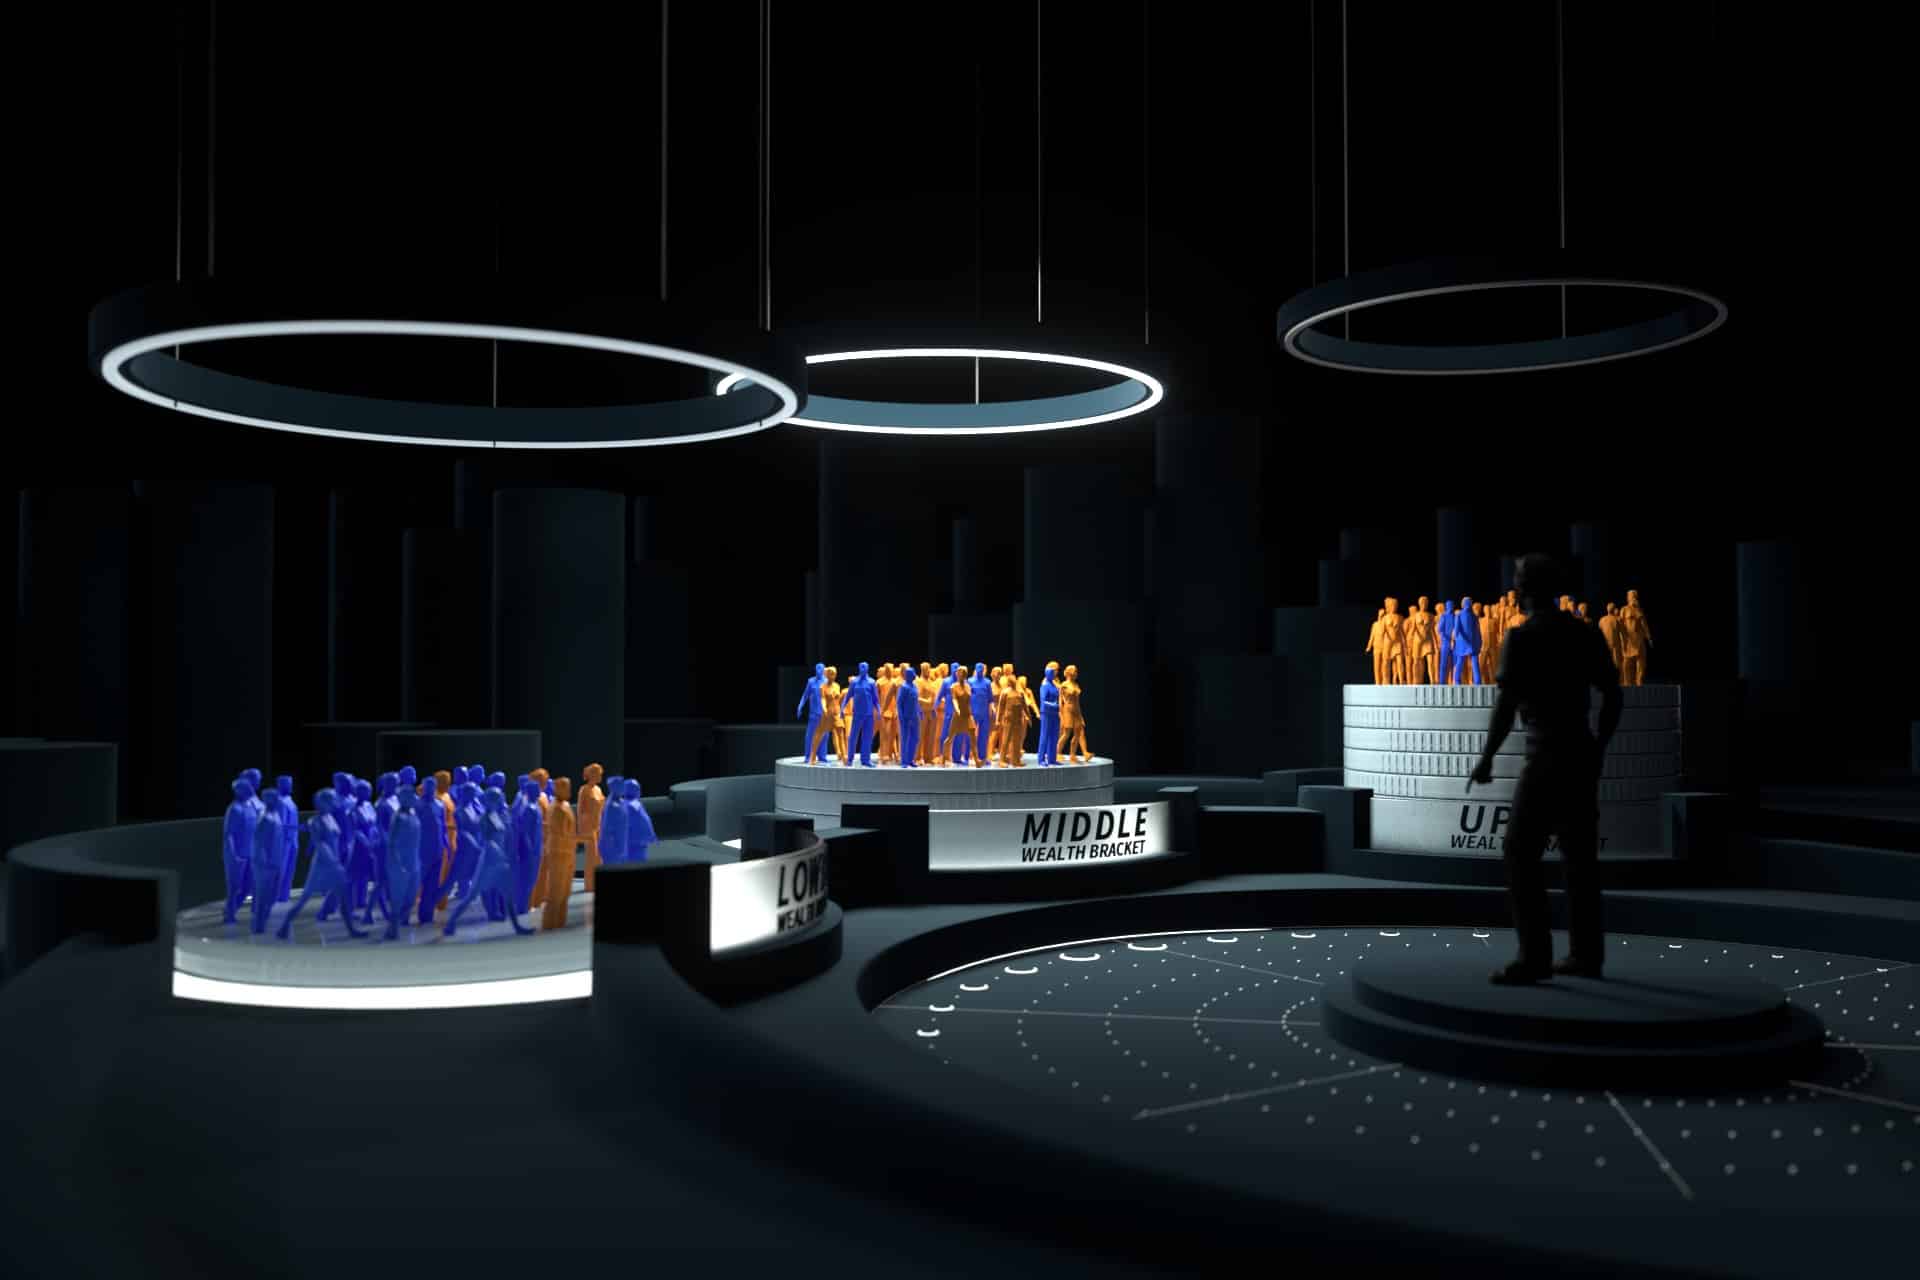
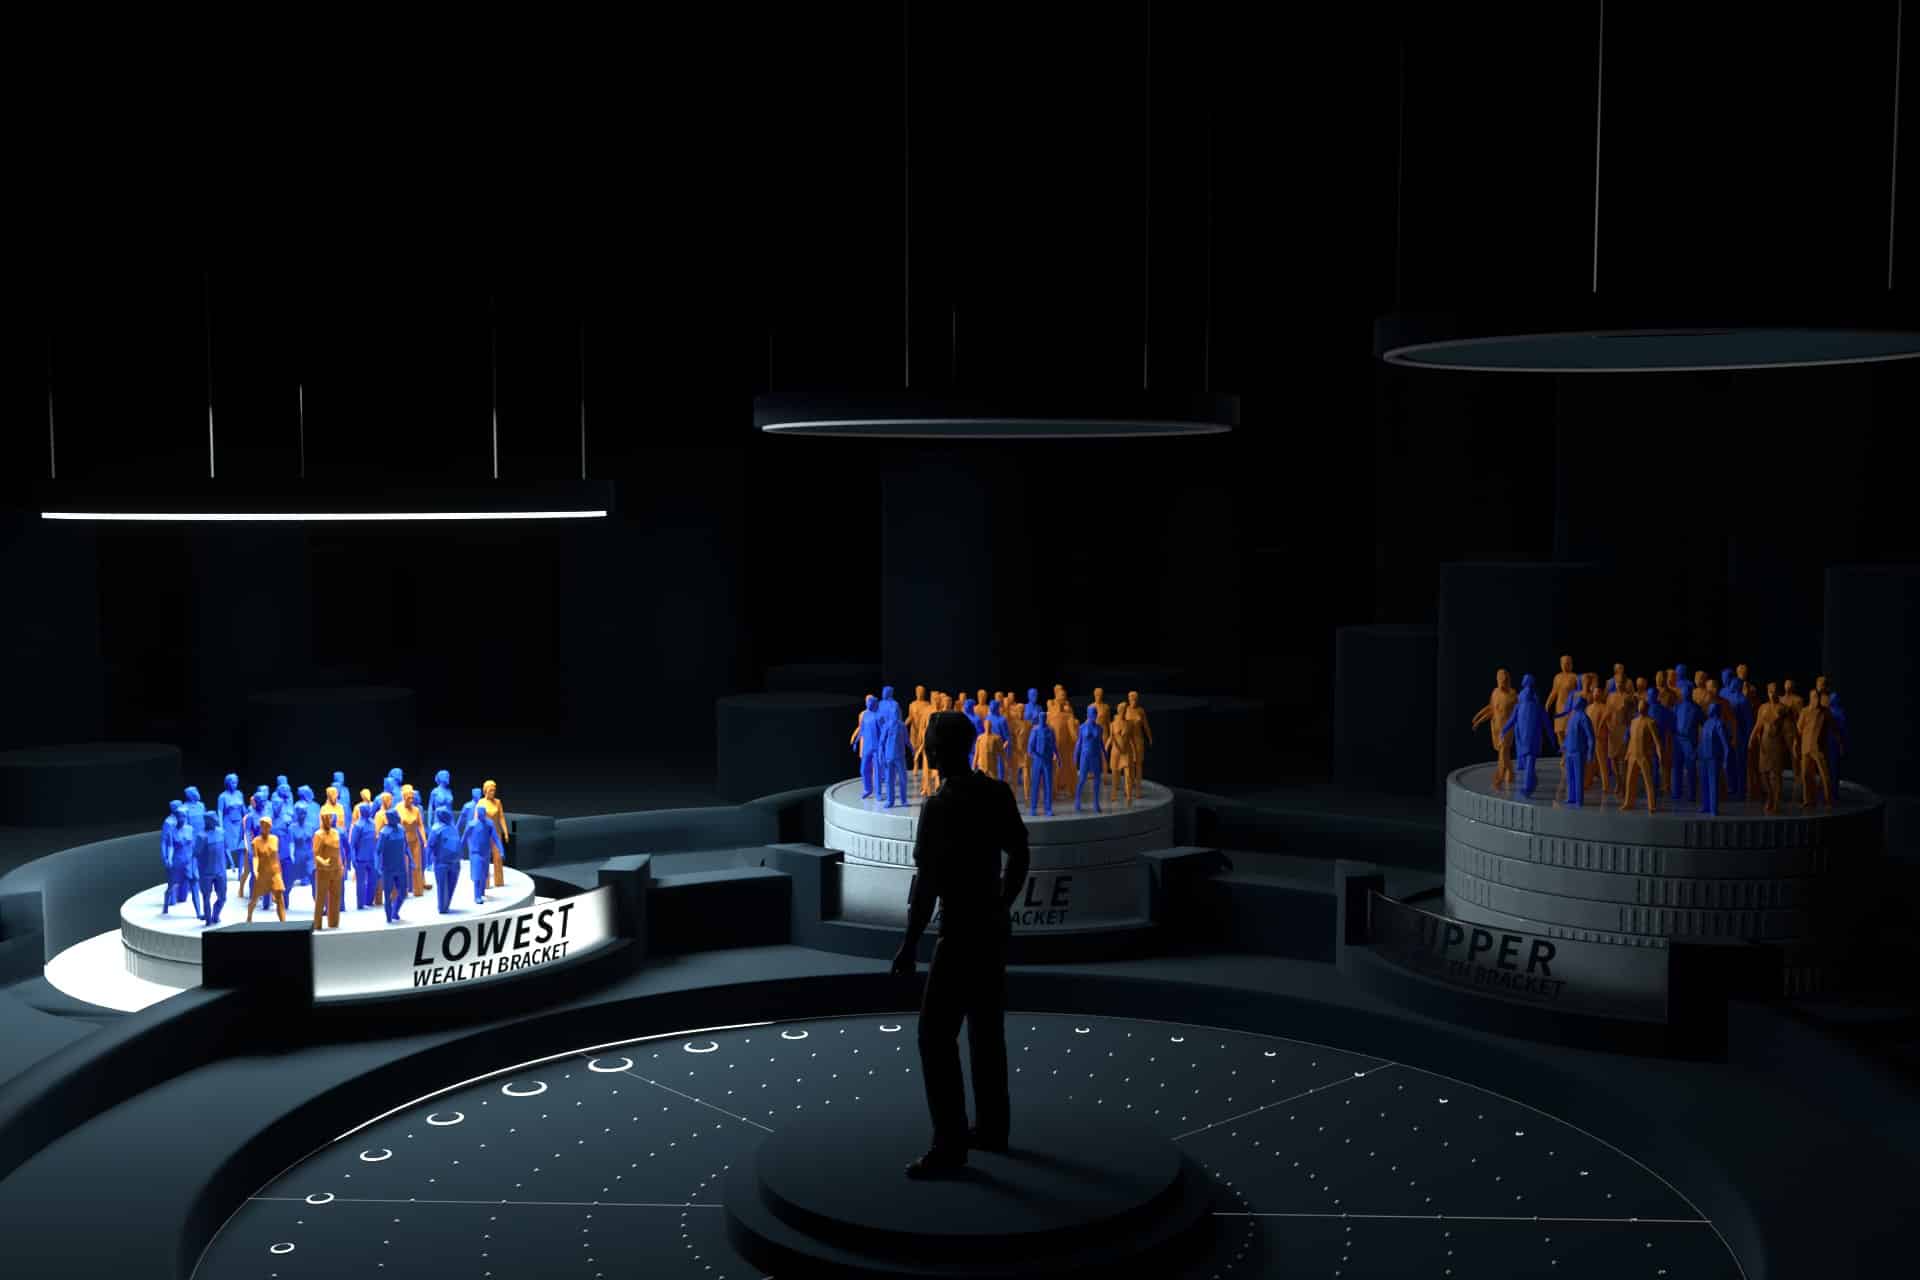
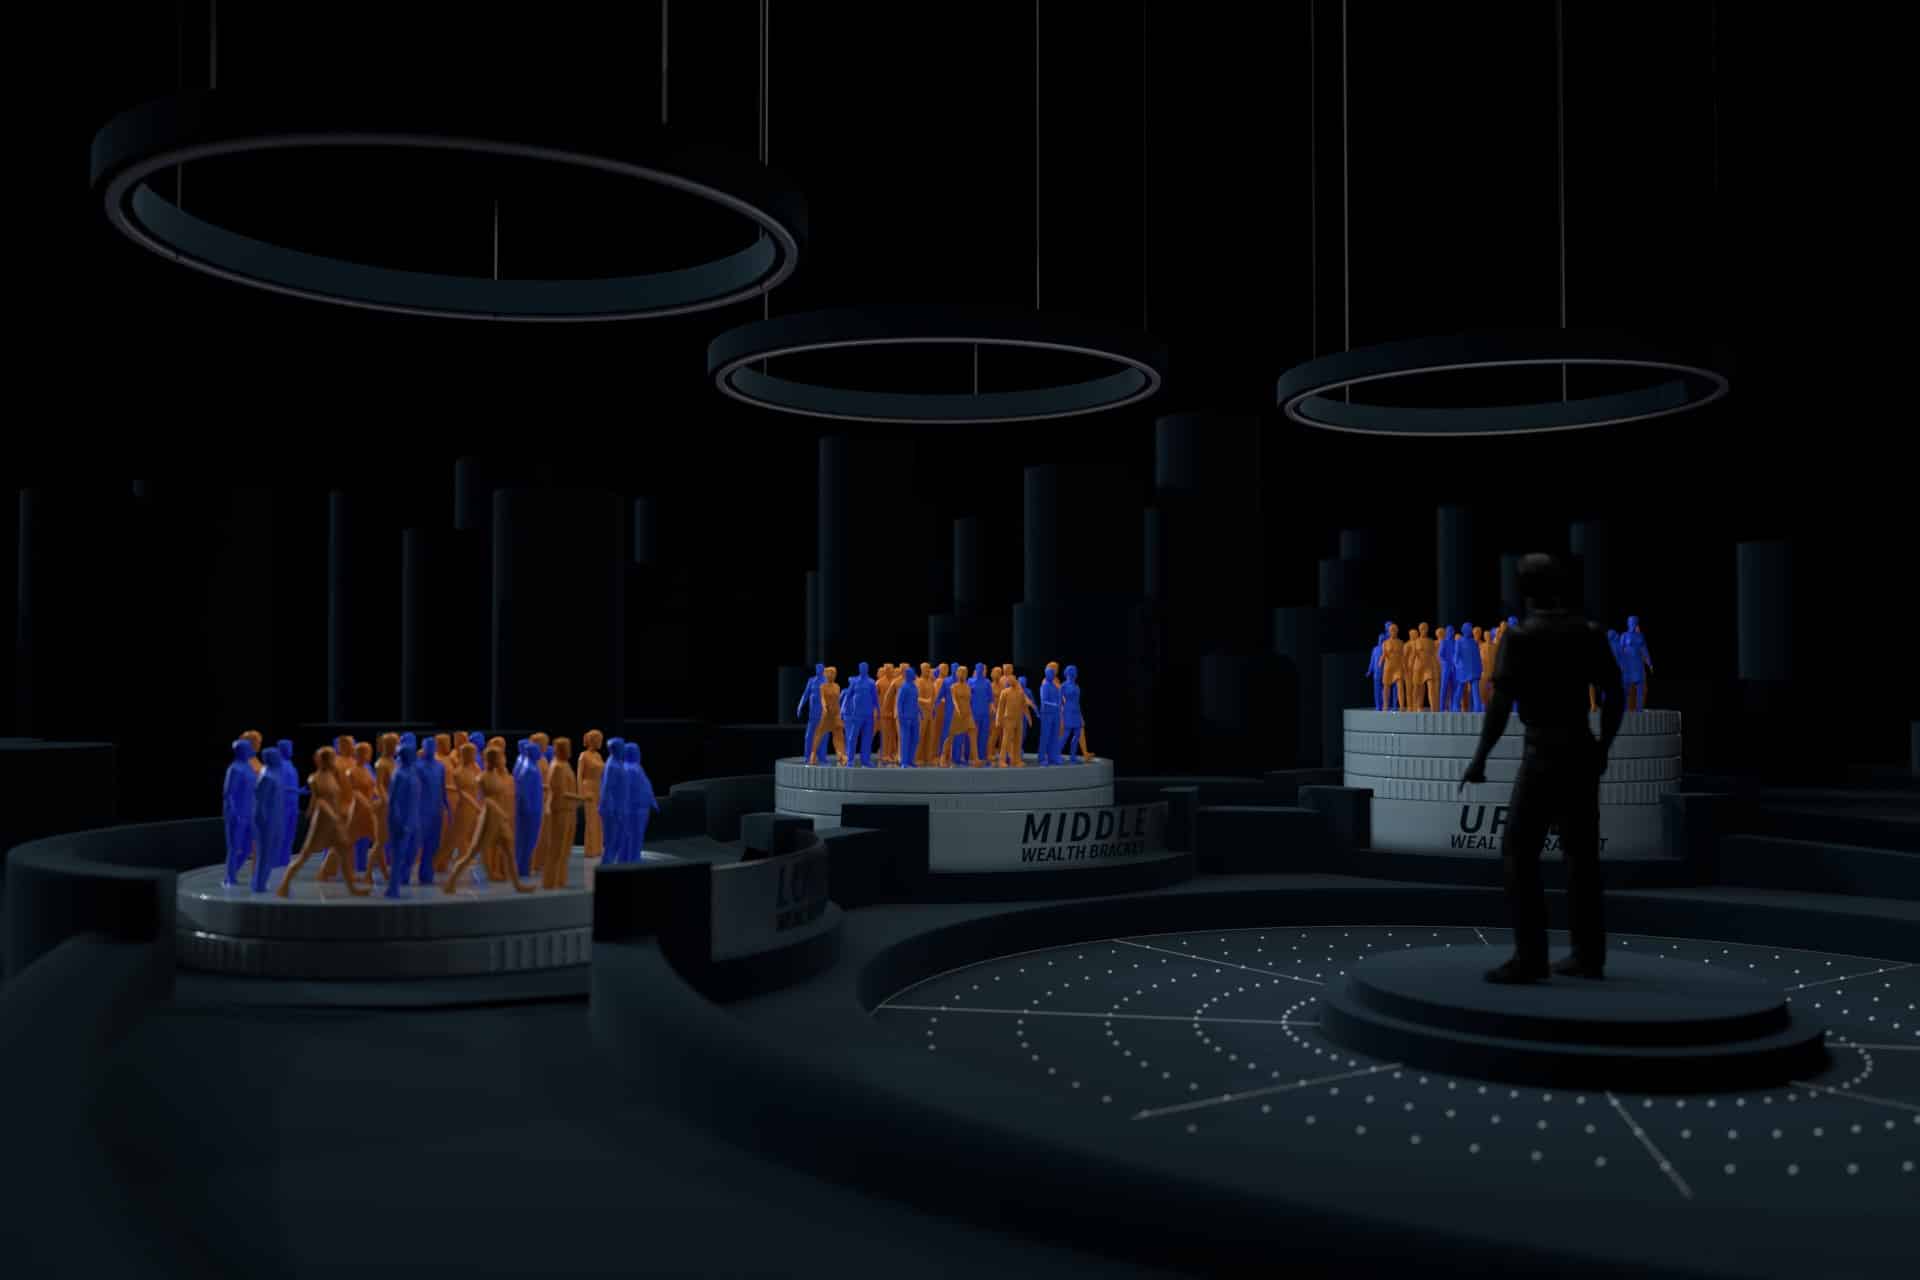
Once this was complete, we moved into full 360 video production of the Little World of Data. This included full production of a 4min linear 360 video experience with four data graphs / visualisations to align with the signed off content & visual style.
Happy Finish built upon the approved visual style set from the approved static keyframe including intro/outro screens, 4x key stories including transitions, embellishments and animation.
Once all visuals and visual aesthetic were approved, we moved into animating the full experience, pulling the stories together into a coherent and seamless linear 360 experience.
Solution
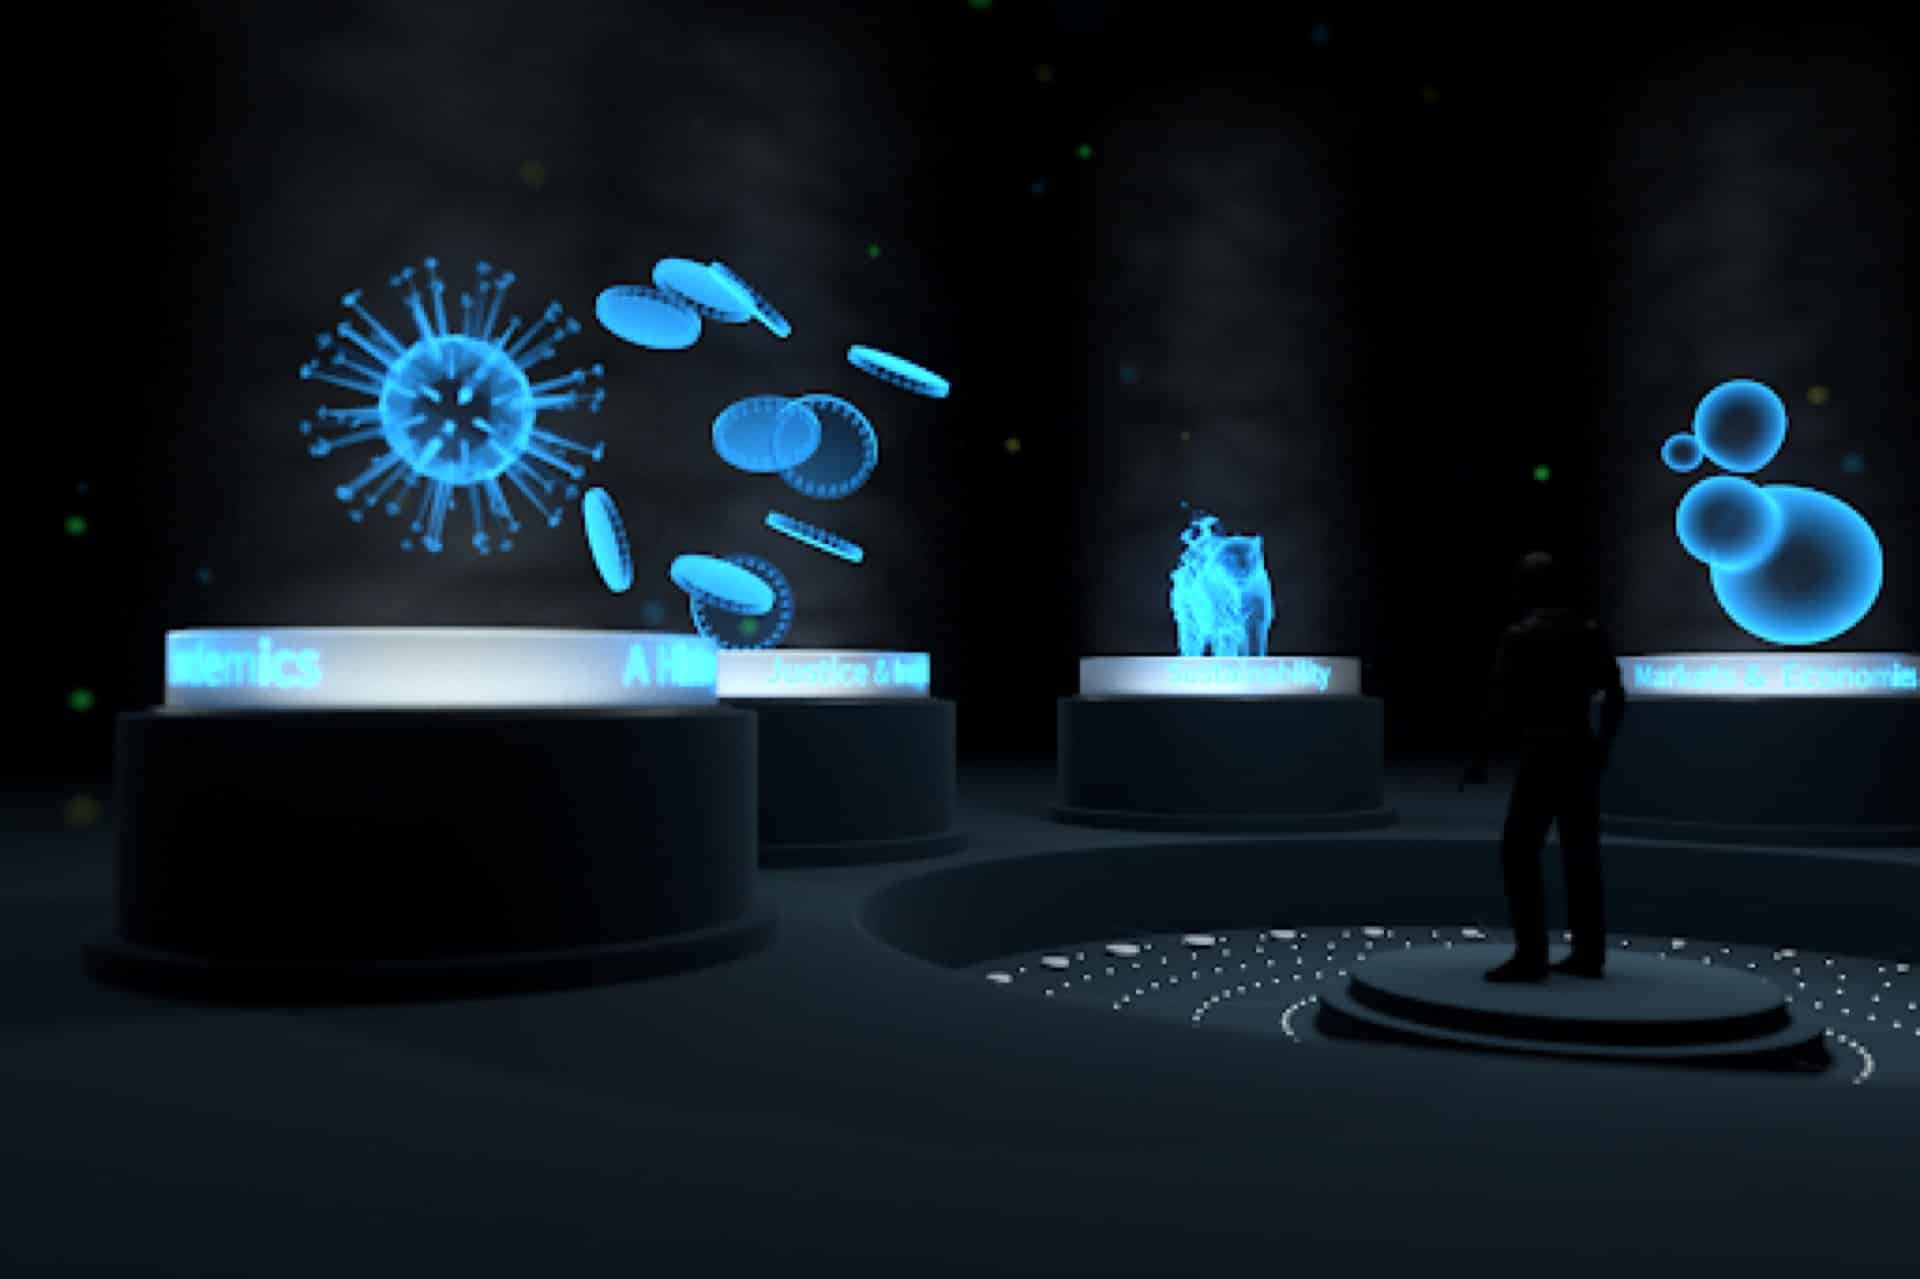
An immersive VR Experience designed to take you on a deep dive into data, taking you on a journey through a range of topics affecting people and the planet.
The VR experience provided users with a unique data visualisation tool that drive significantly greater engagement rates with Aviva’s annual insights piece.
Using branded Google Cardboards, we delivered the experience on mass, direct to people’s homes. On receiving the cardboard users were able to follow clear instructions and scan the cardboard to launch the experience.
Within the experience, we gave users the ability to explore various graphs, data maps and visualisations, leveraging motion graphics and 360 techniques to fully immerse users – showcasing how beautiful data can actually be!
